

Discover the top telecom technical support KPIs to track in 2026, from first call resolution to cost per contact, with current benchmarks and common mistakes.
A customer calls about a dropped 5G signal. Your agent is friendly, the chat feels smooth, and the call ends fast. Yet two days later, the same customer calls back with the same problem.
So was that first call really a success?
Without the right numbers, you simply cannot tell. That is exactly why telecom technical support KPIs matter so much. They turn gut feeling into hard proof, and they show you where support wins or quietly fails. Better still, they point you to the exact fix, not just the problem. Below are the top KPIs every telecom technical support team should track in 2026.
Why the Right KPIs Matter
Telecom support is complex by nature. Agents juggle billing, outages, SIM swaps, and tricky device issues every hour. Meanwhile, customer patience keeps shrinking. So you cannot manage what you do not measure. The right telecom technical support metrics reveal three things clearly: how happy customers are, how fast issues get solved, and how much each contact costs. Together, these signals guide smarter staffing, training, and tooling. They also help you spot small problems before they turn into churn.
The Top Telecom Technical Support KPIs to Track
Here are the core technical support KPIs that reveal the full picture. Track them together, not in isolation.
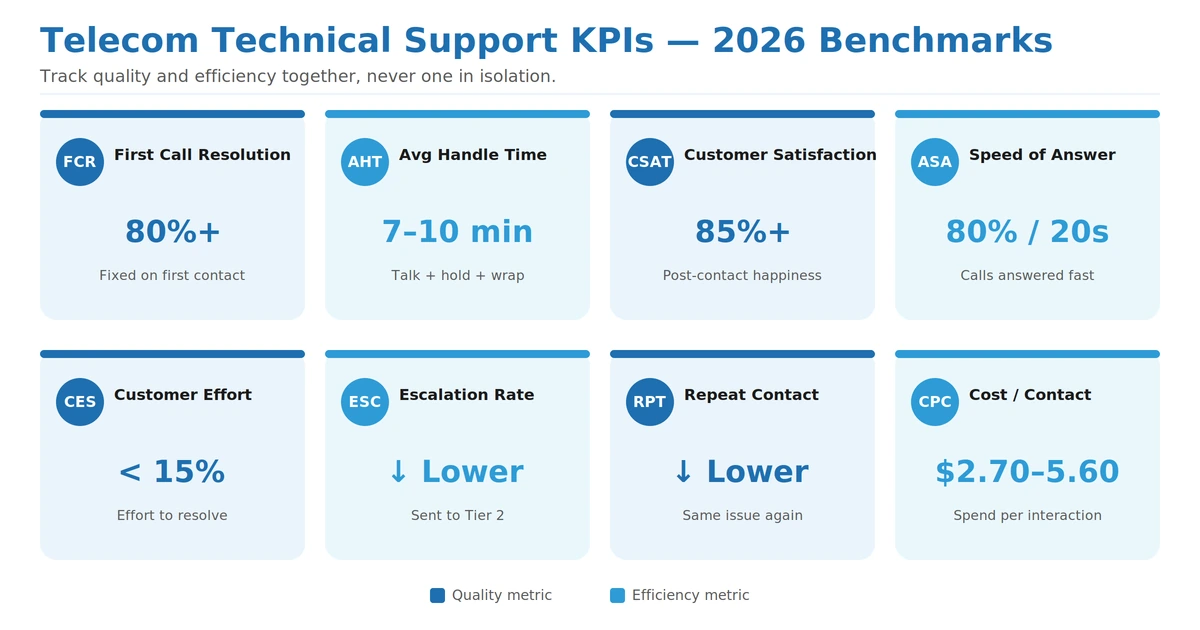 Telecom Technical Support KPIs: 8 Key Benchmarks to Watch in 2026 for Faster Resolution, Better CX & Lower Support Costs.
1. First Call Resolution (FCR)
FCR measures the share of issues solved on the very first contact. It is the single most important metric for technical support. A solid FCR sits between 70% and 79%, while world-class teams top 80%. Notably, only about 5% of centers reach that elite mark. Because complex telecom issues are hard, tech queues often run a little lower. Still, higher FCR means happier customers and lower costs. It also eases pressure on your whole team, since fewer repeat calls flood the queue. AI assist tools can lift first-call resolution further by guiding agents in real time.
2. Average Handle Time (AHT)
AHT is the total time per interaction, including talk, hold, and after-call work. Telecom technical calls typically run 7 to 10 minutes, longer than routine service calls. Therefore, read AHT next to FCR, never alone. A very low AHT can hide rushed calls that trigger repeat contacts. In short, aim for efficient, not just fast. The goal is to solve the issue fully, even if that takes an extra minute.
3. Customer Satisfaction (CSAT)
CSAT captures how happy a customer feels right after an interaction. A good score ranges from 75% to 85%, and the 2026 bar is rising toward 85% or higher. It is a direct read on service quality and loyalty. As a result, falling CSAT is an early warning of churn. Track it by issue type to spot weak spots fast. For example, a low score on outage calls points to a very different fix than a low score on billing.
4. Average Speed of Answer and Service Level
These telecom customer support KPIs track how quickly you pick up. A common target is answering 80% of calls within 20 seconds. Meanwhile, keep the abandonment rate at or below 5%. Long waits frustrate customers before troubleshooting even begins. Consequently, slow answers drag down every other score.
5. Customer Effort Score (CES)
CES asks how hard it was to get an issue resolved. Ideally, keep “high effort” replies below 10% to 15%. Importantly, CES predicts repeat calls and churn better than CSAT alone. That is because effort captures friction that a smile cannot hide. So a low-effort experience keeps customers loyal. Ask the CES question right after the issue is closed for the most honest answer.
6. Escalation and Transfer Rate
This metric shows how often tickets jump to Tier 2 or a specialist. A rising rate usually points to training or knowledge gaps. Moreover, every transfer adds cost and tests customer patience. Therefore, track it closely and feed the findings back into coaching and escalation workflows. Lower escalations often lift FCR at the same time.
7. Repeat Contact Rate
Repeat contact rate counts customers who come back about the same issue within a few days. It is the honest twin of FCR. A high rate exposes “fake” first-call closes that looked good on paper. Because repeat calls waste time and money, this is a telecom help desk metric worth watching. It also reveals the hidden cost of deflection, where issues are pushed off rather than solved. Lower it, and both cost and churn fall.
8. Cost per Contact
Cost per contact divides total support cost by the number of contacts handled. Typical interactions run about $2.70 to $5.60, and complex tech calls cost more. Crucially, it ties service quality straight to the bottom line. At telecom volumes, even small gains add up to big savings. So watch it alongside FCR and CSAT for the full story. A cheap contact that fails to fix the issue is never truly cheap.
Telecom Technical Support KPI Benchmarks for 2026
The table below sums up healthy targets for each KPI.
| KPI | What It Measures | Benchmark |
|---|---|---|
| First Call Resolution | Issues fixed on first contact | 70% to 80%+ |
| Average Handle Time | Total time per interaction | 7 to 10 minutes (tech) |
| Customer Satisfaction | Post-contact happiness | 85% or higher |
| Speed of Answer | Calls answered quickly | 80% within 20 seconds |
| Customer Effort Score | Ease of resolution | High effort below 15% |
| Escalation Rate | Tickets sent to Tier 2 | As low as possible |
| Repeat Contact Rate | Same issue, second contact | As low as possible |
| Cost per Contact | Spend per interaction | $2.70 to $5.60+ |
Common KPI Tracking Mistakes to Avoid
Tracking telecom technical support KPIs sounds simple, yet many teams slip up. These mistakes quietly hide the truth:
- Chasing speed over quality, so AHT drops but repeat calls climb.
- Sampling too few calls, which buries real problems in averages.
- Ignoring CES, and missing hidden effort that drives churn.
- Siloed metrics that never connect to cost or loyalty.
- No real-time view, so issues surface far too late to fix.
Because of these traps, one number alone can mislead you. Therefore, always read your KPIs as a connected set.
Read Your KPIs Together
No single metric tells the whole story. For example, a great AHT means little if repeat contacts are high. Likewise, strong CSAT with poor FCR hints at deeper process gaps. So the smartest teams pair efficiency metrics with quality metrics. In addition, they review trends weekly, not just monthly, with clear service performance reporting. This way, small problems get fixed before they grow. They also share the numbers openly with agents, which builds ownership and drives steady improvement.
Powering Smarter Telecom Technical Support
Tracking KPIs is only half the battle; acting on them is where results come from. Sequential Tech helps telecom operators do both. Our teams deliver technical support, customer care, billing, activations, and retention across voice, chat, and social. In addition, we pair skilled agents with AI-powered quality tools that score every call, lift first-call resolution, and reduce churn. Whether you run an MNO or an MVNO, we help you hit your KPI targets and keep customers happy.